소개
- Helm: Kubernetes의 패키지 관리 도구로, yaml 파일의 모음
- Prometheus: 대상 시스템으로부터 각종 모니터링 지표를 수집하고 저장하는 오픈소스 모니터링 도구
- Grafana: Prometheus의 시각화 부분이 빈약하여 시각화 기능을 보강하기 위해 사용하는 오픈소스 시각화 도구
- Spring Actuator: Spring Boot Application의 여러가지 정보를 쉽게 모니터링 할 수 있게 도와주는 도구
- Metric: 현재 시스템의 상태를 알 수 있는 측정값
- Minikube: Kubernetes 환경을 로컬에서 간단하게 구축할 수 있는 도구
- Kubectl: Command로 Kubernetes 리소스들을 관리할 수 있는 도구
설치
# minikube
brew install minikube

# kubectl
brew install kubectl

# helm
brew install helm

# minikube 동작
minikube start
Prometheus 구성
namespace 생성
# monitor namespace 생성
kubectl create namespace monitor

# 생성한 monitor namespace로 이동
kubectl config set-context --current --namespace monitor
namespace 확인
kubectl config get-contexts
helm repository에 등록 및 설치
# repo 등록
helm repo add prometheus-hjkang https://prometheus-community.github.io/helm-charts

# 설치
helm install prometheus prometheus-hjkang/prometheus
monitor 네임스페이스 안에 prometheus 관련 pods 생성되었는지 확인
- alertmanager: alerts을 관리하는 파드
- kube-state-metrics: Kubernetes Cluster 내부의 자원(CPU, 메모리, 디스크 및 각 컨테이너가 사용하고 있는 리소스 현황, 네트워크 I/O, 정상 컨테이너, 비정상 컨테이너 개수 등)에 대한 매트릭을 수집해주는 exporter
- node-exporter: 서버 노드의 자원에 대한 매트릭을 수집해주는 exporter
- pushgateway: 매트릭을 푸시할 수 있는 중간 서비스
- server: Prometheus WEB UI를 띄울 수 있는 서버
kubectl get pod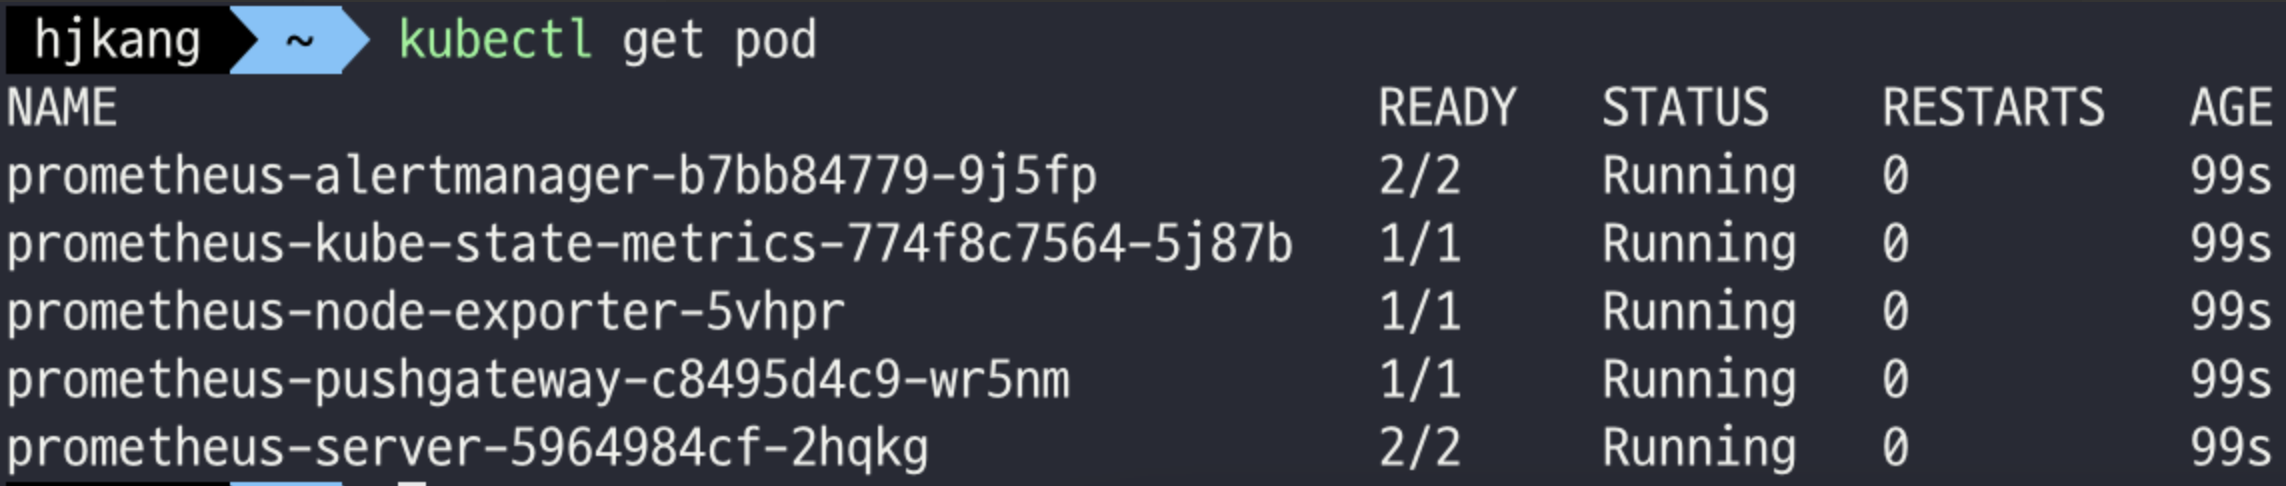
prometheus-server pod를 포트 포워딩 하여 localhost:9090 으로 접속
kubectl port-forward prometheus-server-5964984cf-2hqkg 9090

제대로 연결되었는지 확인하기 위해 kubelet_running_pods 실행
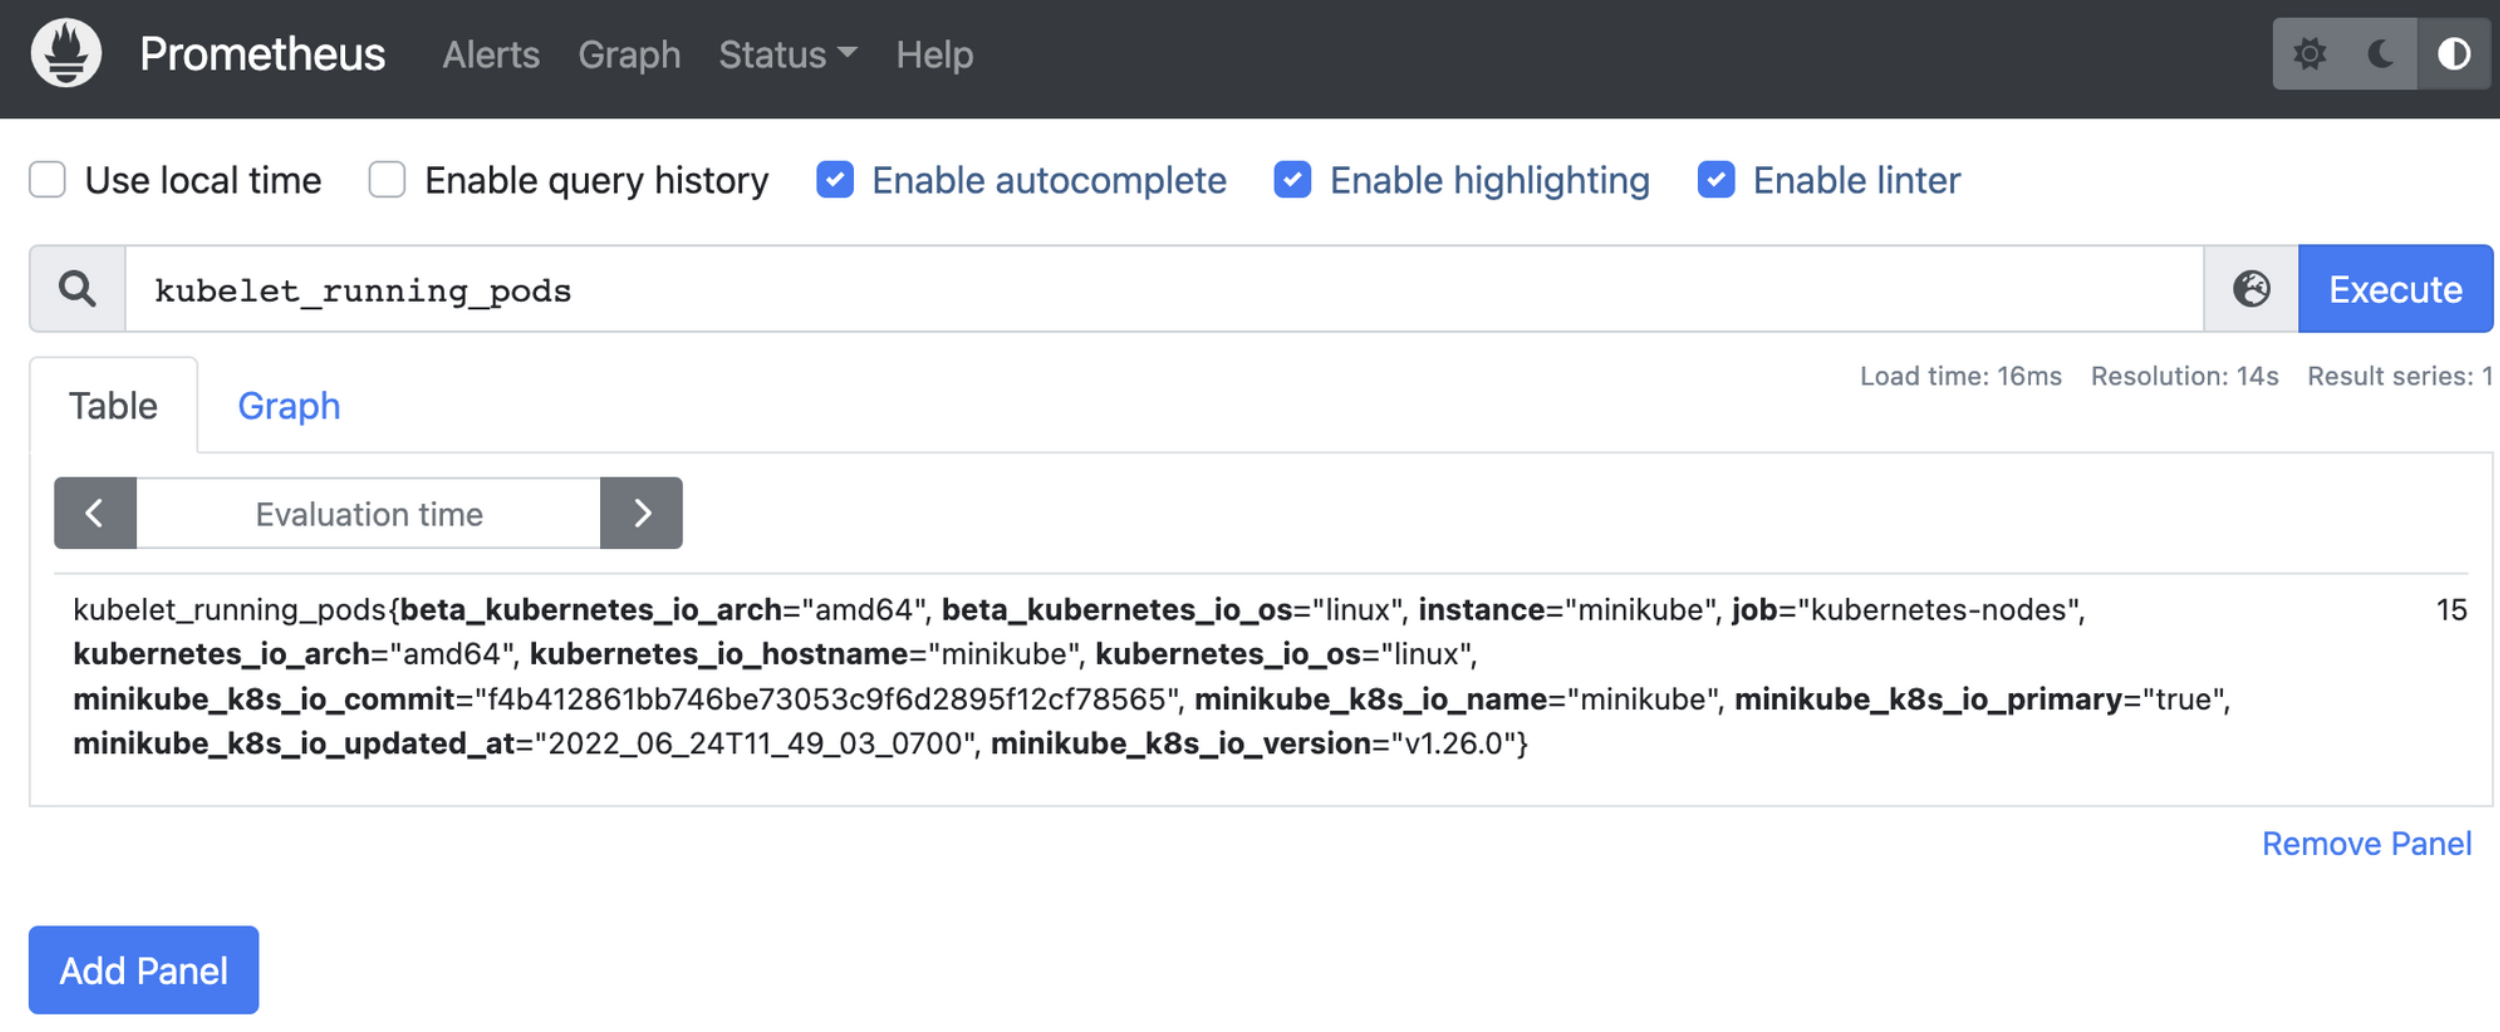
총 15개의 pod가 실행 중이라는 결과가 출력되는데, kubectl을 사용하여 실행 중인 pod의 개수 비교
kubectl get pod --all-namespaces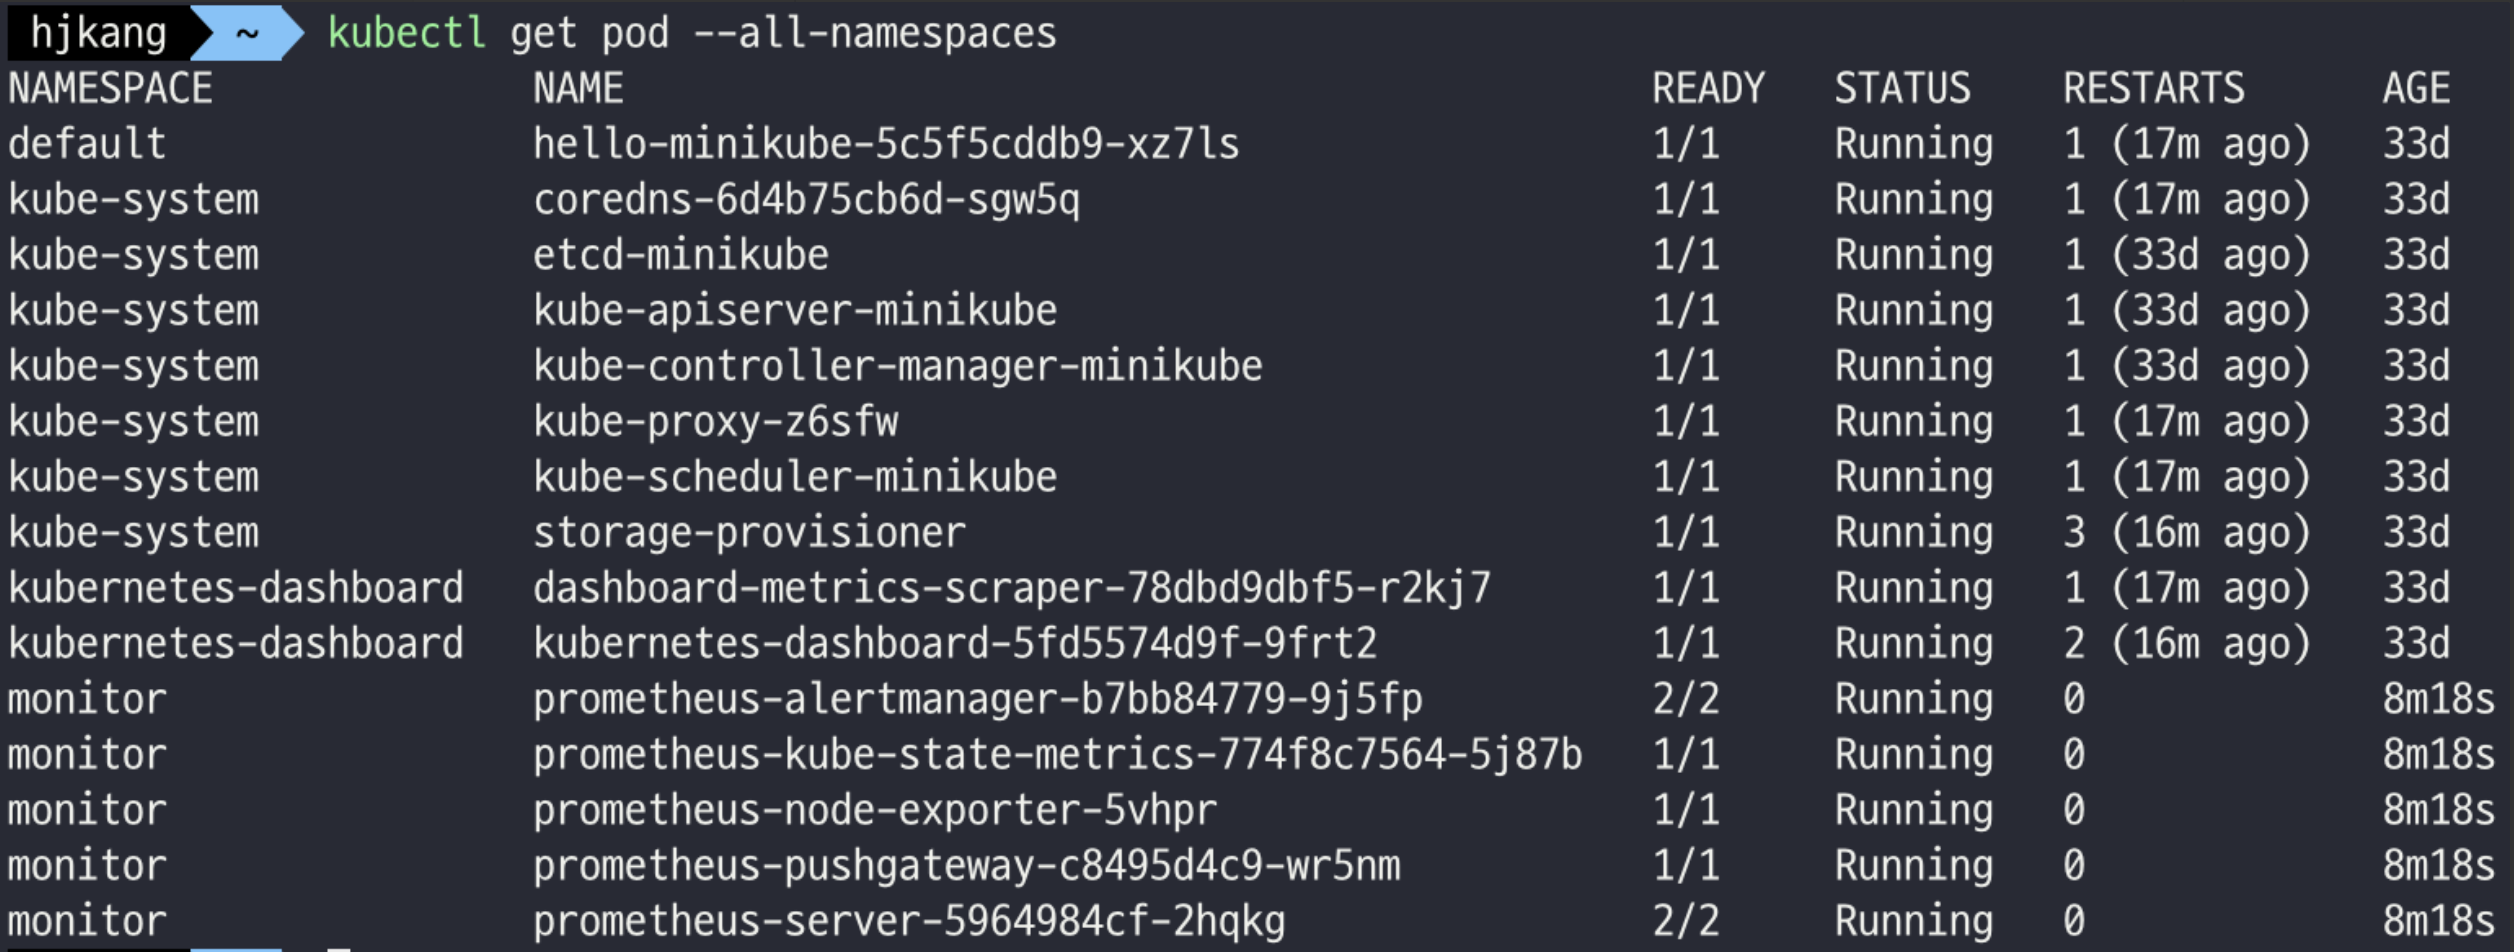
일치함!!
Grafana 구성
helm repository에 등록 및 설치
# helm repository 추가
helm repo add grafana https://grafana.github.io/helm-charts

# helm install grafana
helm install grafana grafana/grafana
출력된 가이드를 따라 admin user의 비밀번호 확인
kubectl get secret --namespace monitor grafana -o jsonpath="{.data.admin-password}" | base64 --decode ; echo
pod 확인
kubectl get pod --all-namespaces
포트 포워딩하여 localhost:3000으로 접속 후 admin 계정으로 로그인(비밀번호는 아까 확인한 값 입력)
kubectl port-forward grafana-75589fc946-jh7s8 3000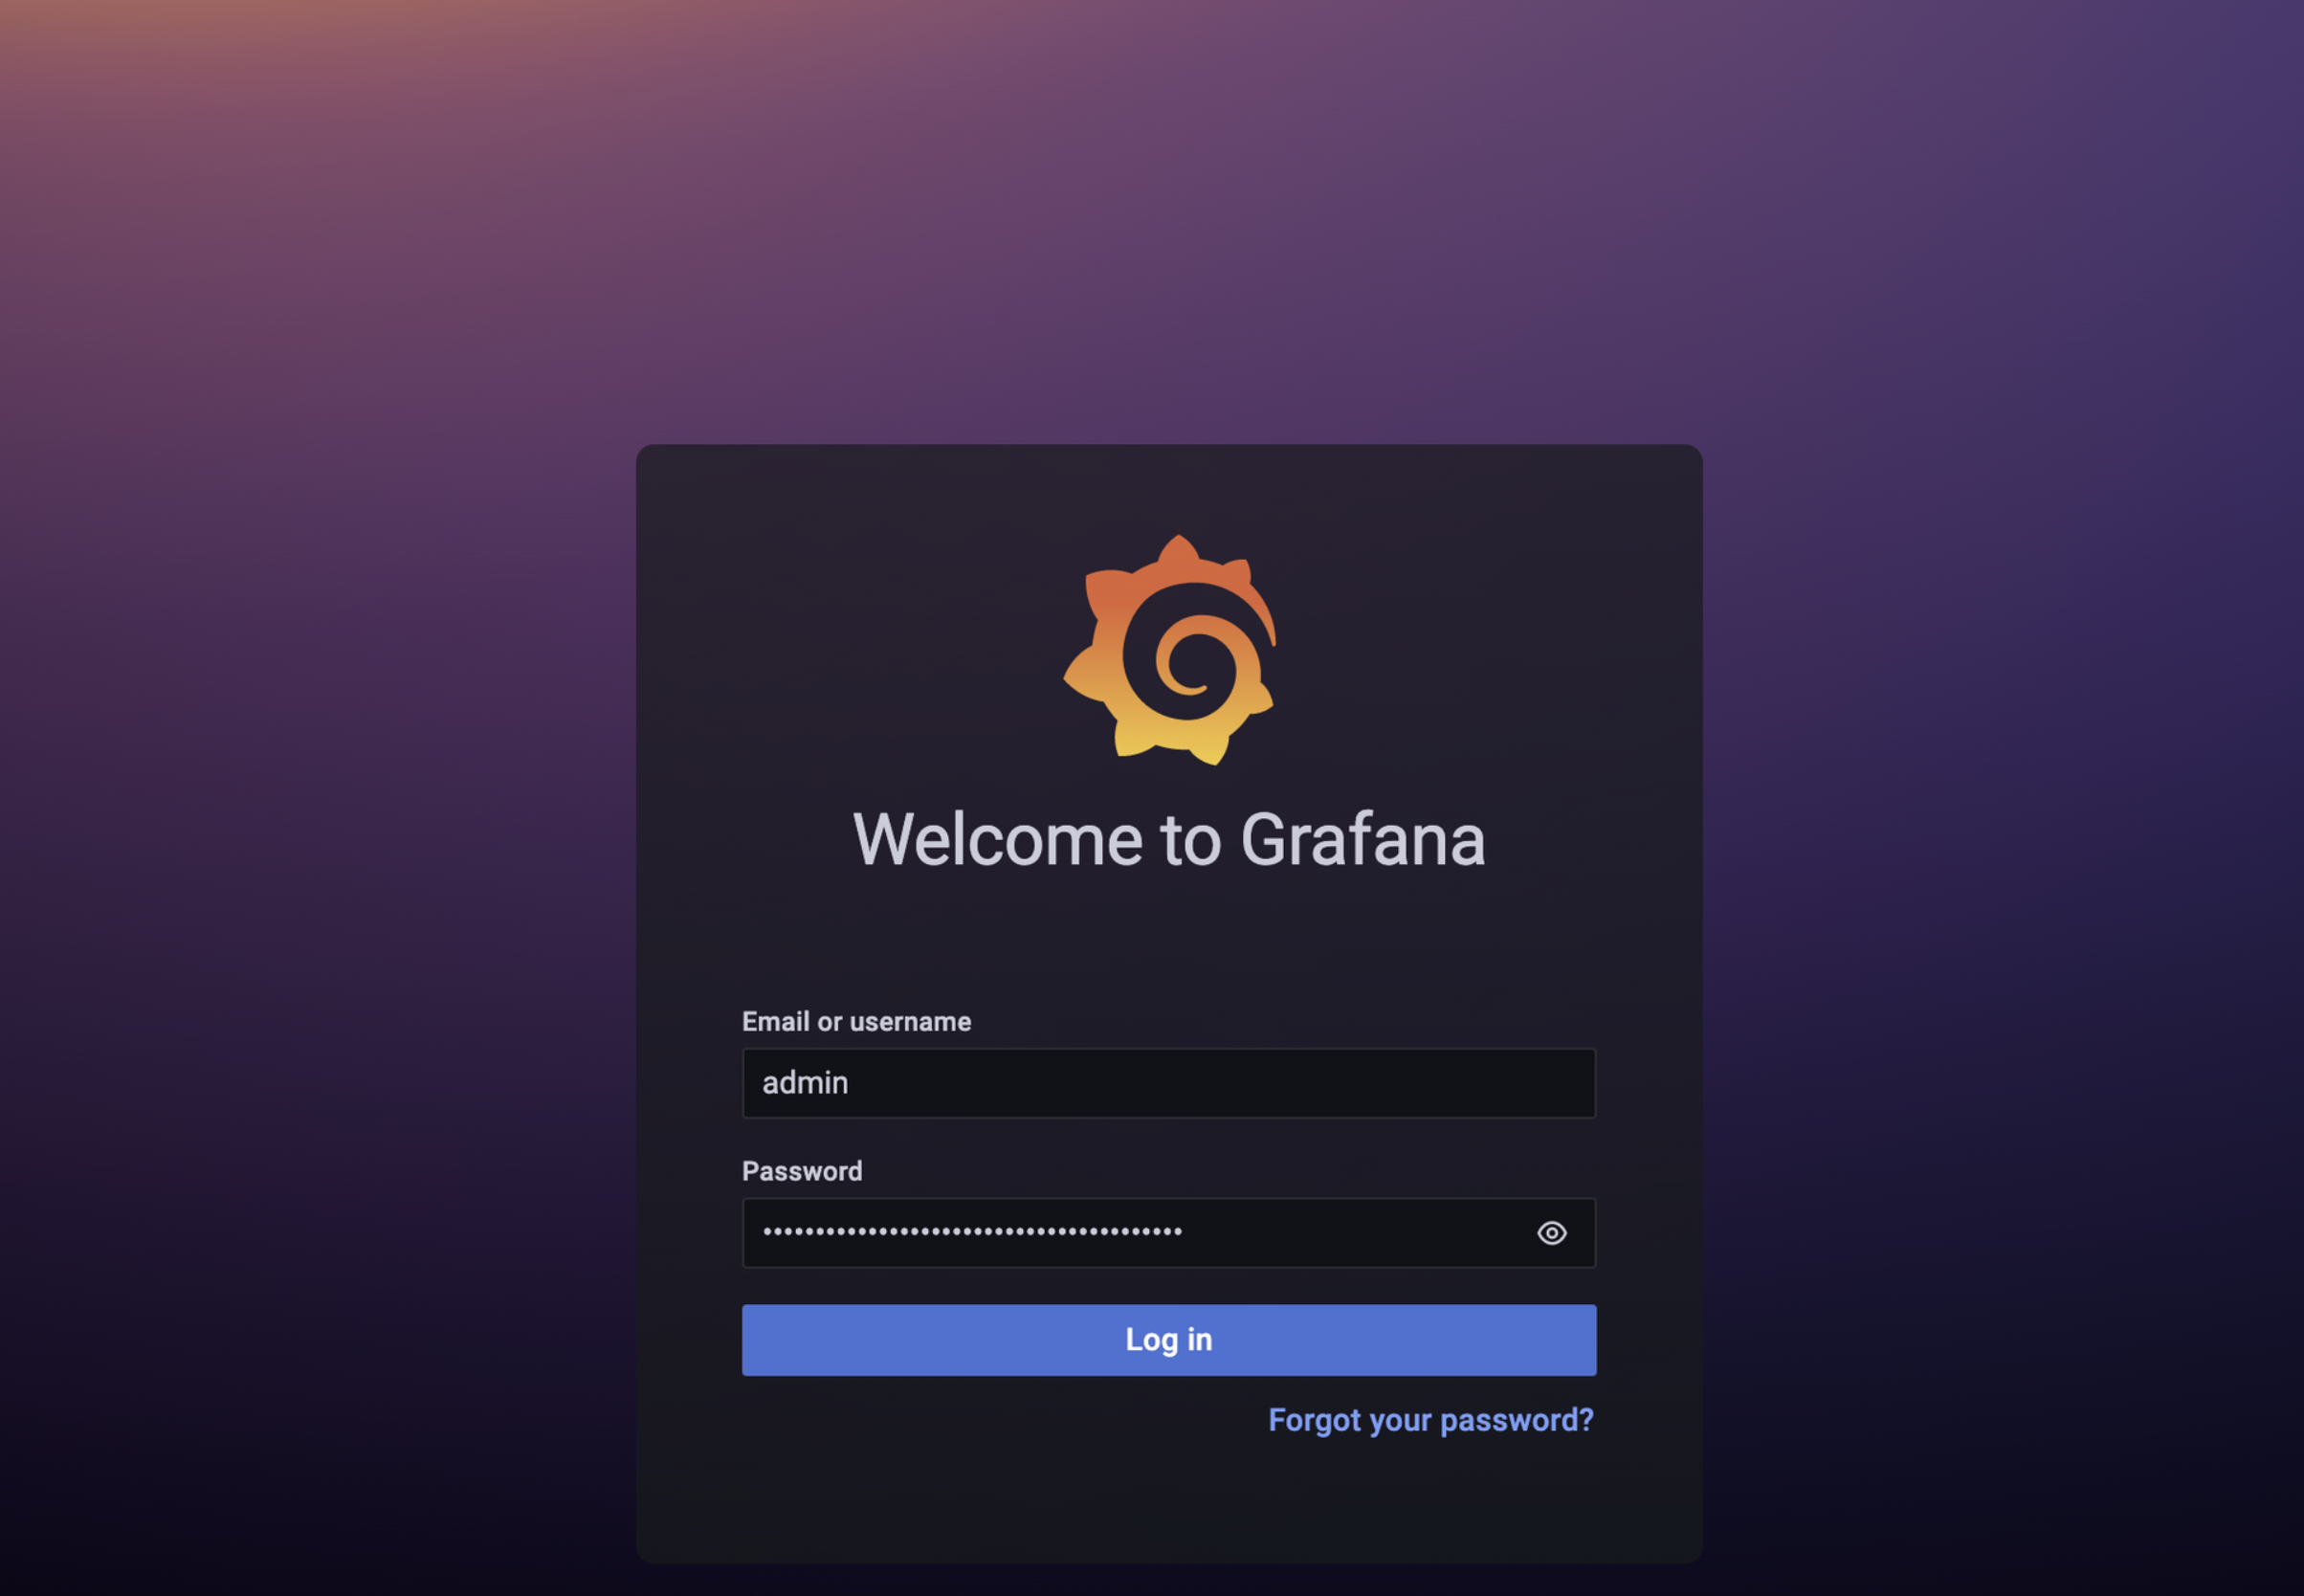
Configuration 메뉴로 이동 후 Add data source -> Prometheus 선택
url 등록 위해 prometheus-server endpoints 조회 후 출력된 endpoints를 url 란에 입력
kubectl get ep prometheus-server

대시보드 테마 적용

Node Exporter Full 선택 (우측의 ID 값 기억: 1860)

Import -> ID 값 1860 입력 -> Load -> Prometheus 선택 -> Import


테마 적용된 화면

Spring Boot 구성
application.yaml
spring:
  datasource:
    url: jdbc:postgresql://localhost:5555/postgres
    username: postgres
    password: postgres
    driverClassName: org.postgresql.Driver

  jpa:
    hibernate:
      ddl-auto: create
    show-sql: true
    properties:
      hibernate:
        dialect: org.hibernate.dialect.PostgreSQLDialect
        format_sql: true

  application:
    name: monitor

management:
  endpoint:
    health:
      enabled: true
    metrics:
      enabled: true
    prometheus:
      enabled: true

  endpoints:
    web:
      exposure:
        # include: '*'
        include: health, info, metrics, prometheus
  metrics:
    export:
      atlas:
        enabled: false
    tags:
      application: ${spring.application.name}
build.gradle
plugins {
	id 'org.springframework.boot' version '2.7.1'
	id 'io.spring.dependency-management' version '1.0.11.RELEASE'
	id 'java'
}

group = 'billing.api'
version = '0.0.1-SNAPSHOT'
sourceCompatibility = '17'

repositories {
	mavenCentral()
}

dependencies {
	implementation 'org.springframework.boot:spring-boot-starter-data-jpa'
	implementation 'org.springframework.boot:spring-boot-starter-web'
	implementation 'io.micrometer:micrometer-core'
	implementation 'io.micrometer:micrometer-registry-prometheus'
	implementation 'org.springframework.boot:spring-boot-starter-actuator'
	runtimeOnly 'org.postgresql:postgresql'
	testImplementation 'org.springframework.boot:spring-boot-starter-test'
}

tasks.named('test') {
	useJUnitPlatform()
}
AppApplication.java
package billing.api.billingapi;

import org.springframework.boot.SpringApplication;
import org.springframework.boot.autoconfigure.SpringBootApplication;
import org.springframework.web.bind.annotation.GetMapping;
import org.springframework.web.bind.annotation.RestController;

@SpringBootApplication
@RestController
public class BillingApiApplication {
	@GetMapping("/")
	public String home() {
		return "home";
	}
	@GetMapping("/end-point1")
	public String endPoint1() {
		return "endPoint1";
	}
	@GetMapping("//end-point2")
	public String endPoint2() {
		return "endPoint2";
	}

	public static void main(String[] args) {
		SpringApplication.run(BillingApiApplication.class, args);
	}

}
로컬에서 실행 후 actuator 확인

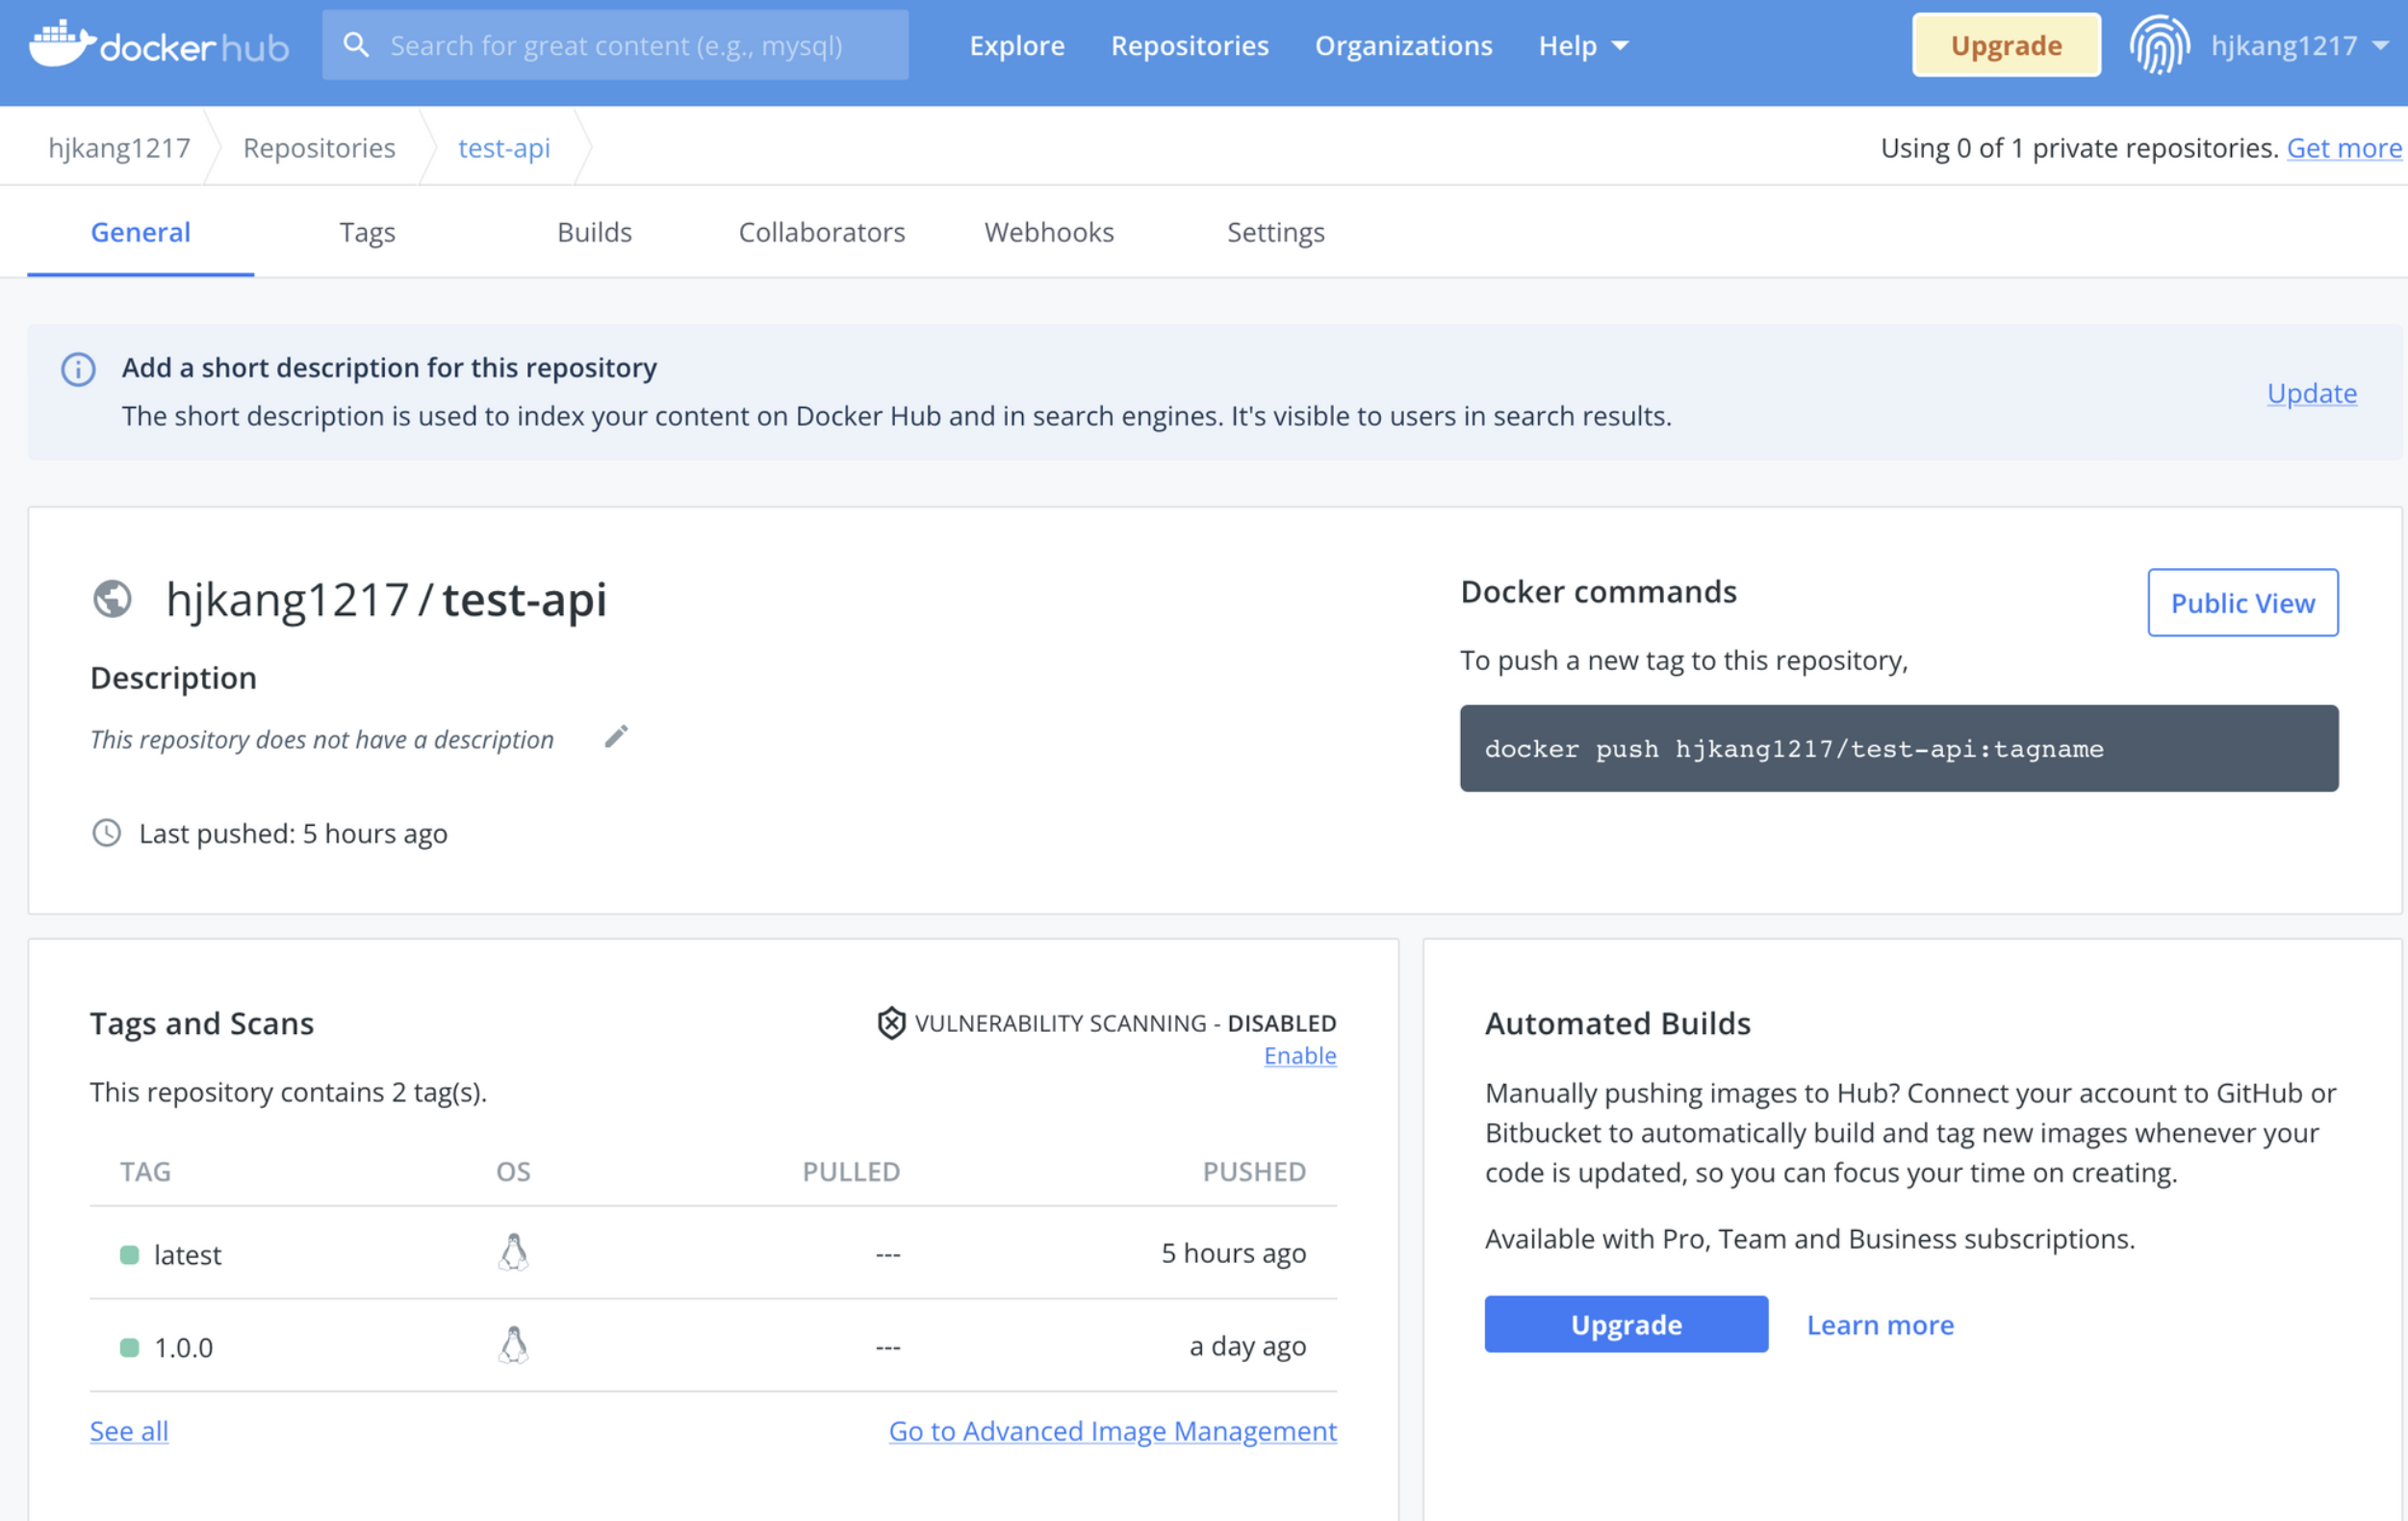
docker image docker hub에 push
# 이미지 생성
docker build -t test-api .

# 이미지 태그 추가
docker tag test-api hjkang1217/test-api:latest

# Docker Hub에 배포
docker push hjkang1217/test-api:latest
https://hub.docker.com/repository/docker/hjkang1217/test-api 에 올라간 것 확인
k8s 폴더 생성 후 직접 deployment, service 작성하거나 kubectl create 이용해서 만들자
mkdir k8s
kubectl create deployment monitor --image hjkang1217/test-api:1.0.0 --dry-run -oyaml > ./deployment.yaml
kubectl create service clusterip monitor --tcp=8080:8080 --dry-run -oyaml > ./service.yaml
deployment.yaml(spec.template 부분 수정 필요)
apiVersion: apps/v1
kind: Deployment
metadata:
  creationTimestamp: null
  labels:
    app: monitor
  name: monitor
spec:
  replicas: 1
  selector:
    matchLabels:
      app: monitor
  strategy: {}
  template:
    metadata:
      creationTimestamp: null
      labels:
        app: monitor
      annotations:
        prometheus.io/scrape: "true"
        prometheus.io/port: "8080"
        prometheus.io/path: /actuator/prometheus
    spec:
      containers:
      - image: hjkang1217/test-api:latest
        name: test-api
        imagePullPolicy: Always
        ports:
          - containerPort: 8080
        resources: {}
status: {}
service.yaml
apiVersion: v1
kind: Service
metadata:
  creationTimestamp: null
  labels:
    app: monitor
  name: monitor
spec:
  ports:
  - name: 8080-8080
    port: 8080
    protocol: TCP
    targetPort: 8080
  selector:
    app: monitor
  type: ClusterIP
status:
  loadBalancer: {}
배포
kubectl apply -f ./
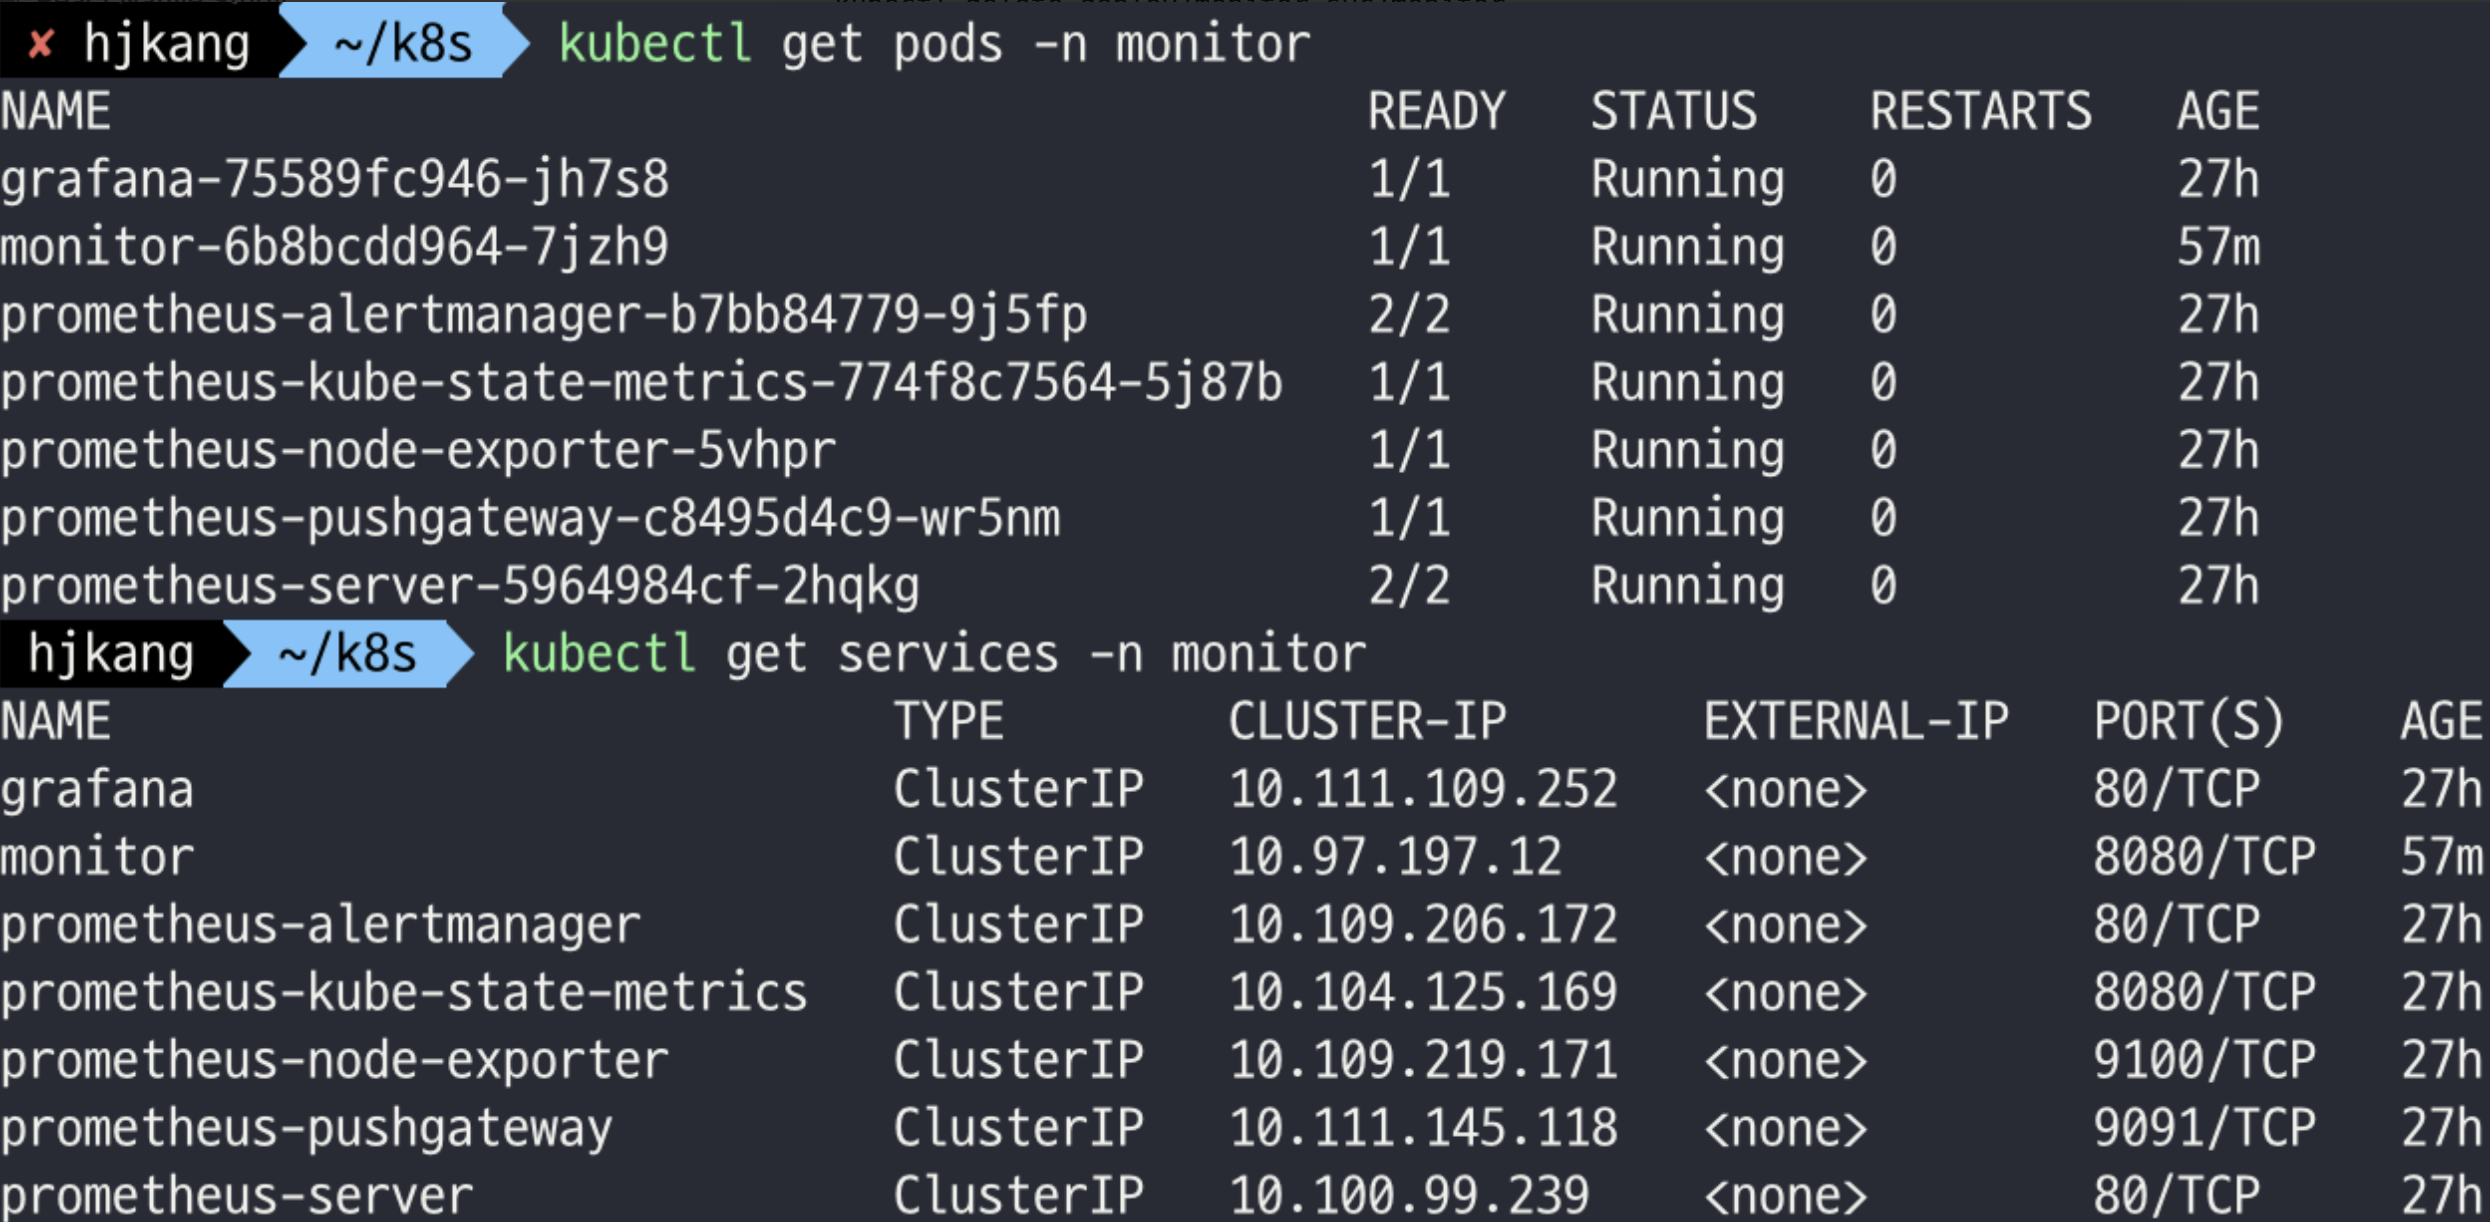
pod, service 배포 확인
kubectl get pods -n monitor
kubectl get services -n monitor

# 상세 보기
kubectl get pods -o wide -n monitor
kubectl get services -o wide -n monitor

# 삭제 후 재생성은
kubectl delete deploy/monitor svc/monitor
kubectl get pods -n monitor
kubectl get services -n monitor
포트 포워딩하여 로컬에서 접속
kubectl port-forward svc/monitor 8080:8080
Prometheus에서도 확인해보자
- Status > Targets 에서 kubernetes-pods 확인

- Graph 메뉴에서 prometheus_http_requests_total 입력 후 실행


Grafana에서도 확인
- New dashboard → Add a new panel
- Metric에 prometheus_http_requests_total 입력 후 Run Queries

- Apply시 대시보드에 추가됨

참고
'Java&Spring' 카테고리의 다른 글
| Java - 쿠키(Cookie) (0) | 2023.10.01 |
|---|---|
| Autowired와 private final의 차이 (0) | 2023.04.19 |